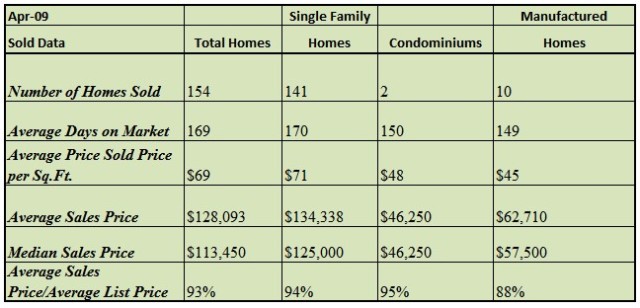
Foreclosed properties continue to impact the Lakeland real estate market. Lakeland’s average sales price of $128,093 ($69.22 per sq.ft.) for April slumped 25% from the previous year, prices dropped also 5 ¾ % from the previous month. A slight increase in properties sold of 154 Lakeland properties were sold in April compared to 152 homes sold the previous month.
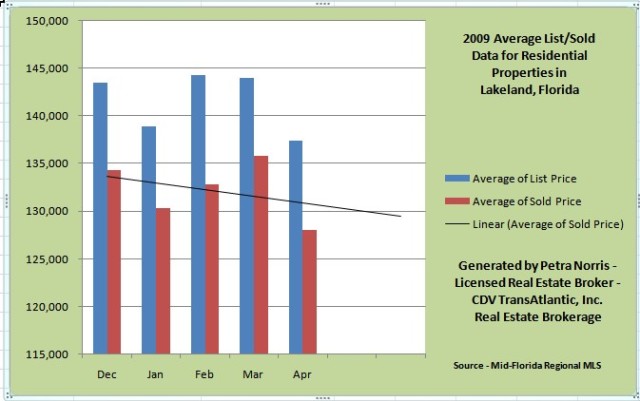
Bank-Owned properties are the “Name of the Game”
The distressed homes and more importantly the bank-owned (REO) properties dominate the sales activities here in Lakeland with 88 properties sold in April and continuously over 50% of the total sales since the beginning of the year recorded accordingly in Mid-Florida Regional MLS.
With close to 2467 properties currently for sale and pending, we are experiencing approximately a 15 month of supply for the regular homes and distressed homes.
Distressed properties are homes in pre-foreclosure, foreclosure, bank-owned, as well as short sales. These types of homes continue to control our real estate market here in Lakeland Florida as well as throughout Polk County, so it is important for you to see what is driving down the home prices, but more importantly our home values.
Of the 154 homes sold last month in Lakeland, 88 distressed homes were sold with an average sales price of $108,900 ($58.91 per sq.ft.) compared to only 30 homes that were sold the previous year, due to Short Sales and/or Foreclosures. Bank-owned properties are the “name of the game” with 62 out of 88 properties was bank-owned (REO).
Let’s break it down for you to see the supply and demand for common properties for sale versus the distressed market.
Common properties only – Inventory active and pending 1602 homes resulting in 27 month of supply.
Distressed properties – Inventory active and pending 865 homes resulting in an 11 month supply.
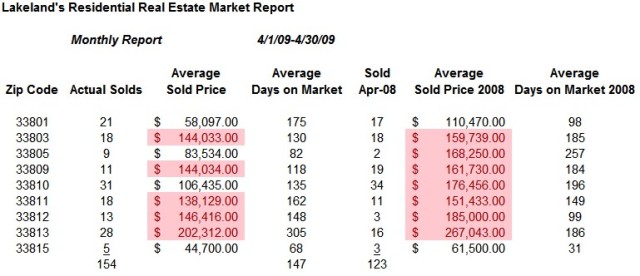
Take a look at my spreadsheet below. I’ve separated the report by zip code instead of school zones; it gives you a more accurate report in my opinion. The data and graphs for this report were obtained from the Mid-Florida Regional MLS, it is deemed reliable but not guaranteed. This report does not include “For Sale By Owner”. The numbers highlighted in pink represents the zip codes where average sold prices have exceeded.
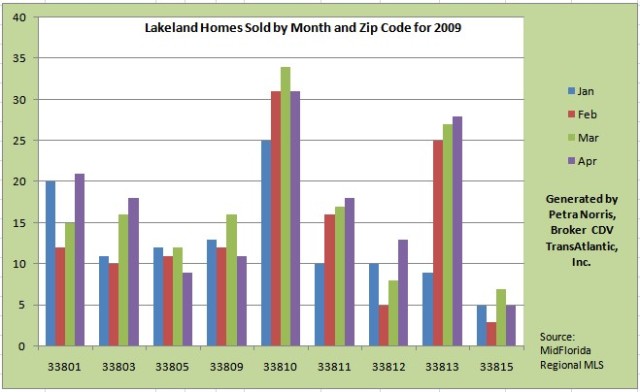
Which zip codes represents the most sales activities since January 2009?
For more information on the location of these sold properties in Lakeland, price and size of the home click on map picture which leads you to the interactive Community Walk map created by Chuck Welch of Lakeland Local.
Let’s take a look at last month sold report for the surrounding cities in Polk County:
Winter Haven – 102 properties sold – average sold price $101,120 – average $59.75 per sq.ft.
Bartow – 12 properties sold – average sold price $112,366 average $64.14 per sq.ft.
Mulberry – 16 properties sold – average sold price $115,658 – average $65.81 per sq.ft.
Auburndale – 13 properties sold – average sold price $148,161 – average $79.02 per sq.ft.
Polk City – 3 properties sold – average sold price $56,300 – $51.40 per sq.ft.
Lake Alfred – 7 properties sold – average sold price $104,785- $54.99 per sq.ft.
If you are interested in a specific area or neighborhood, feel free to call me at (863) 61906918 or click the button below to start your Lakeland real estate search!

How does the market look for June in Lakeland? Are prices continuing to drop or are they leveling out and slowing going up? I enjoy looking at your weekly market updates – please keep posting them.
thanks