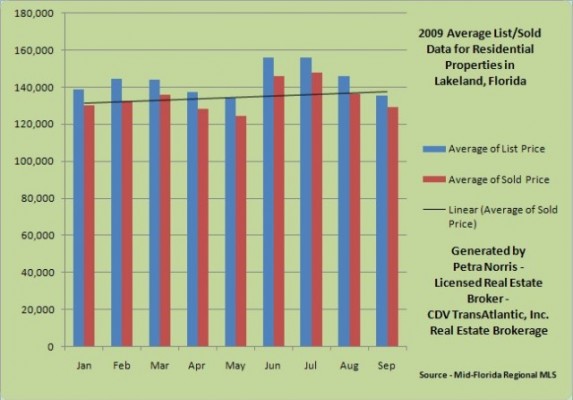
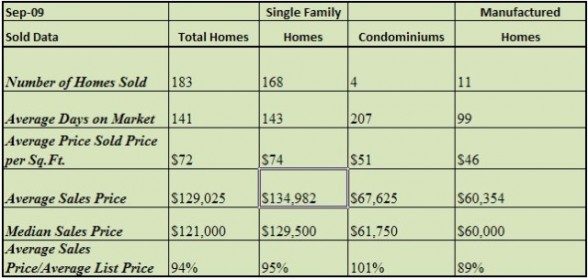
Lakeland real estate sales activity in September reached its second highest level this year. A total of 183 homes were sold increase of 9% from the previous month of 166. Last year’s activity, home sales increased by 16% from September 2008 in Lakeland, Florida.
Lakeland home sale prices troubles the Lakeland real estate market
Median prices dipped for September to $121,000 or 7% for homes sold in Lakeland when comparing to the previous month. Average sold prices decreased to $129,025 ($72.18 per sq.ft.) or 5.35% from the previous month and 21% from the previous year, respectively.
- Average Lakeland Sold price for September 2008 – $164,462 – decrease of 21%
- Median Lakeland sold price for September 2008 – $149,900 – decrease of 19%

Based on recent sales history for the Lakeland Real Estate market, it shows here in this spreadsheet below where the most activity takes place and what types of homes are selling.

Distressed properties in Lakeland, Florida
For the month of September, distressed homes, such as Lakeland Short Sales, pre-foreclosures, in foreclosures and bank-owned (REO) properties had a market share of 54% in the Lakeland Real Estate market. There were a total of 98 properties sold in September compared to 43 distressed Lakeland homes sold the year prior, according to Mid-Florida Regional MLS.
- Average days on market (DOM) for bank-owned properties are 85 days
- Average days on market (DOM) for other distressed properties, such as Lakeland short sale homes are 183 days.
27 Distressed Homes Sold – average sold price $147,775 – $71.76 per sq.ft.
71 Bank-owned (REO) sold – average sold price $95,380 – $53.30 per sq.ft.
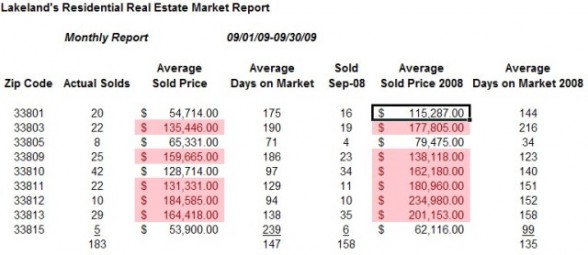
Take a look at my spreadsheet below. I’ve separated the report by zip code instead of school zones; it gives you a more accurate report in my opinion. The data and graphs for this report were obtained from the Mid-Florida Regional MLS, it is deemed reliable but not guaranteed. This report does not include “For Sale By Owner”. The numbers highlighted in pink represents the zip codes where average sold prices have exceeded.

Which zip codes represents the most sales activities since January 2009?
| Lakeland | Jan | Feb | Mar | Apr | May | Jun | Jul | Aug | Sep | Grand Total |
| 33801 |
20 |
12 |
15 |
21 |
13 |
16 |
17 |
12 |
20 |
146 |
| 33803 |
11 |
10 |
16 |
18 |
16 |
19 |
26 |
19 |
22 |
157 |
| 33805 |
12 |
11 |
12 |
9 |
5 |
10 |
14 |
14 |
8 |
95 |
| 33809 |
13 |
12 |
16 |
11 |
18 |
17 |
16 |
17 |
25 |
145 |
| 33810 |
25 |
31 |
34 |
31 |
46 |
37 |
40 |
33 |
42 |
319 |
| 33811 |
10 |
16 |
17 |
18 |
18 |
22 |
20 |
15 |
22 |
158 |
| 33812 |
10 |
5 |
8 |
13 |
7 |
9 |
16 |
15 |
10 |
93 |
| 33813 |
9 |
25 |
27 |
28 |
26 |
33 |
35 |
38 |
29 |
250 |
| 33815 |
5 |
3 |
7 |
5 |
7 |
6 |
4 |
3 |
5 |
45 |
| Grand Total |
115 |
125 |
152 |
154 |
156 |
169 |
188 |
166 |
183 |
1408 |
For more information on the location of these sold homes in Lakeland, price and size of the home click on map picture which leads you to the interactive Community Walk map created by Chuck Welch of Lakeland Local.
If you are interested in a specific area or neighborhood, feel free to contact me at petra@petranorris.com or click the search button below.
