Lakeland Florida Real Estate Market for the 2nd quarter
In the first quarter of this year, we have seen momentum with gains in double digits when comparing to the previous year. If you missed the article, just click here.
Taking a look at average sales numbers, April and June had the biggest gains from the previous year. April had an increase by 18% and June had an increase by 9%. Although we peaked in April, sales have dropped when comparing the figures to the previous months.
Take a look at the numbers so far for 2nd quarter of this year:
- April – Med/Avg. sold price: $125,000/148,226 – Sold Homes: 294
- May – Med/Avg. sold price: $130,000/143,358 – Sold Homes:288
- June – Med/Avg. sold price: $121,350/136,031 – Sold Homes: 253
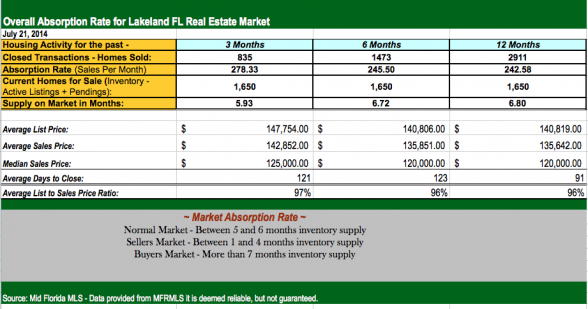
What is the Absorption Rate for Lakeland Fl Real Estate Market?
We currently see that the housing market is stabilizing. This can be seen by this chart below, which shows that Lakeland is experiencing a balanced or normal market.
How is the Lakeland FL housing market performing?
What can you expect for this year?
The overall inventory for Lakeland homes are increasing at a rate of about 350 homes per month. The total inventory of homes for sale in Lakeland is currently 1140. Homes that are priced right and in great condition continue to see multiple offers thereby sometimes exceeding the list price.
We have seen home values increases – some larger than others primarily due to its location and the lower inventory.
For current Lakeland FL Real Estate market statistics, such as median, average and days on market reported by zip codes, please click here.