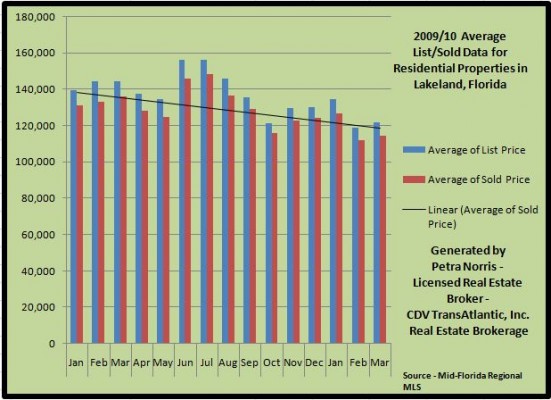
Lakeland real estate sales activity continuously increased the past few months and March showed great improvement. Although there were 235 Lakeland homes sold in March, such number I have not seen since 2007, average and median prices took a double digit steep decline at about 14% from the previous year. Distressed properties are still driving down market values with over 54% of market share. I’m suspecting that as long as we have such high inventory in distress, home prices may still be vulnerable for at least this year.
Lakeland Homes sold in March: 235 – previous month: 152 – previous year March 09: 156 sold
March – average sales price $114,518
Previous month: $111,759 (2.47%) – previous year March 09: $135,224 (-15.31%)
March – median sales price $105,000
Previous month: $96,000 (9.38%) – previous year March 09: $121,750 (13.76%)

The graph below represents average and median prices in Lakeland for various categories. When our media provides us with a real estate market reports, generally these reports outline only Single Family Homes and Condominiums. Lakeland Florida has a variety of homes, such as manufactured homes, townhomes, villas and duplex units.

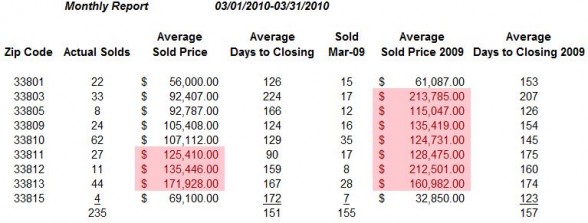
What are the various average prices in each Lakeland zip code?
Take a look at my spreadsheet below. I’ve separated the report by zip code instead of school zones; it gives you a more accurate report in my opinion. The data and graphs for this report were obtained from the Mid-Florida Regional MLS, it is deemed reliable but not guaranteed. This report does not include “For Sale By Owner”. The numbers highlighted in pink represents the zip codes where average sold prices have exceeded.

Lakeland homes sold that are priced right will sell quickly. In my analysis of last month activity shows that home owners, who have marketed their properties at the right price, achieve better results in less time. Here is a breakdown:
- 0-30 days – 93.2% average sold price/list price ratio
- 31-60 days – 97.54% average sold price/list price ratio
- 61-90 days – 95.44% average sold price/list price ratio
- 91-120 days – 94.87% average sold price/list price ratio
- 121+ days – 92.4% average sold price/list price ratio
For more information on the location of these sold homes in Lakeland, price and size of the home click on map picture which leads you to the interactive Community Walk map created by Chuck Welch of Lakeland Local.
Distressed properties in Lakeland, Florida
For the month of March, Lakeland’s real estate market of distressed homes had a market share of 54%. There were a total of 126 properties sold in February, according to Mid-Florida Regional MLS.
Check back soon for March detailed Lakeland Florida Real Estate report that highlights bank-owned properties (REOs) and Lakeland Short Sales.
If you are interested in a specific area or neighborhood, feel free to contact me at petra@petranorris.com or click the search button below.
