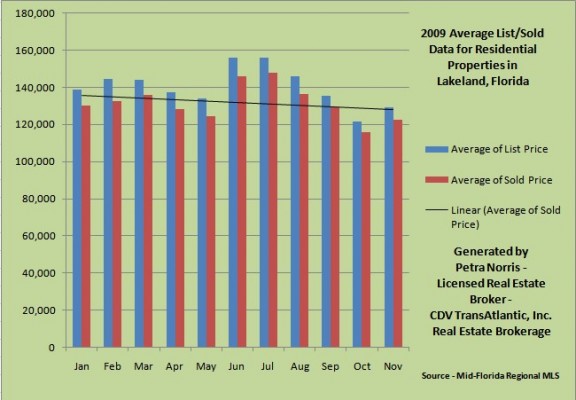
Despite Polk County’s unemployment numbers in the double digits, Lakeland Florida real estate sales activity continued strong for the month of November.
Lakeland Homes sold in November: 174 – previous month: 177 – previous year November 08: 106 sold

Which zip codes represents the most sales activities since January 2009?
| Lakeland | Jan | Feb | Mar | Apr | May | Jun | Jul | Aug | Sep | Oct | Nov | Grand Total |
| 33801 |
20 |
12 |
15 |
21 |
13 |
16 |
17 |
12 |
20 |
27 |
20 |
193 |
| 33803 |
11 |
10 |
16 |
18 |
16 |
19 |
26 |
19 |
22 |
25 |
20 |
202 |
| 33805 |
12 |
11 |
12 |
9 |
5 |
10 |
14 |
14 |
8 |
14 |
12 |
121 |
| 33809 |
13 |
12 |
16 |
11 |
18 |
17 |
16 |
17 |
25 |
17 |
21 |
183 |
| 33810 |
25 |
31 |
34 |
31 |
46 |
37 |
40 |
33 |
42 |
46 |
43 |
408 |
| 33811 |
10 |
16 |
17 |
18 |
18 |
22 |
20 |
15 |
22 |
15 |
18 |
191 |
| 33812 |
10 |
5 |
8 |
13 |
7 |
9 |
16 |
15 |
10 |
9 |
13 |
115 |
| 33813 |
9 |
25 |
27 |
28 |
26 |
33 |
35 |
38 |
29 |
22 |
24 |
296 |
| 33815 |
5 |
3 |
7 |
5 |
7 |
6 |
4 |
3 |
5 |
2 |
3 |
50 |
| Grand Total |
115 |
125 |
152 |
154 |
156 |
169 |
188 |
166 |
183 |
177 |
174 |
1759 |
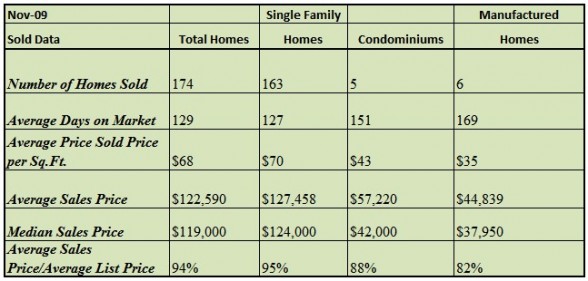
November – average sales price $122,590
Previous month: $115,952 (+ 5.7%) – previous year November 08: $159,241(-23%)
November – median sales price $119,000
Previous month: $107,000 (+11%) – previous year November 08: $142,500 (-16.5%)
The graph below represents average and median prices in Lakeland for various categories.

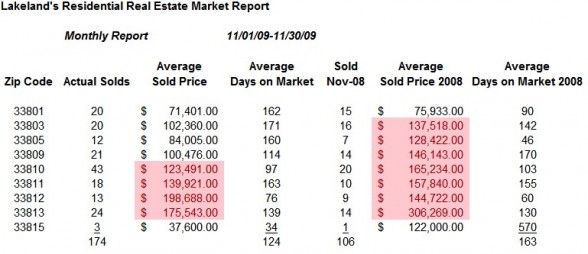
What are the various average prices in each Lakeland zip code?
Take a look at my spreadsheet below. I’ve separated the report by zip code instead of school zones; it gives you a more accurate report in my opinion. The data and graphs for this report were obtained from the Mid-Florida Regional MLS, it is deemed reliable but not guaranteed. This report does not include “For Sale By Owner”. The numbers highlighted in pink represents the zip codes where average sold prices have exceeded.

Distressed properties in Lakeland, Florida
For the month of November, Lakeland’s real estate market of distressed homes and bank-owned (REO) properties had a market share of 53%. There were a total of 92 properties sold in November compared to 36 distressed Lakeland homes sold the year prior, according to Mid-Florida Regional MLS.
Average days on market (DOM) for bank-owned properties are 60 days
Average days on market (DOM) for other distressed properties are 158 days.
29 Distressed Homes Sold – average sold price $124,506 – median sold price $115,000
63 Bank-owned (REO) sold – average sold price $89,084 – median sold price $75,000
For more information on the location of these sold homes in Lakeland, price and size of the home click on map picture which leads you to the interactive Community Walk map created by Chuck Welch of Lakeland Local.
If you are interested in a specific area or neighborhood, feel free to contact me at petra@petranorris.com or click the search button below.
